A Graphic Spark of Inspiration Leads to New Values for Clients
A Game Changer: Graphic Facilitation
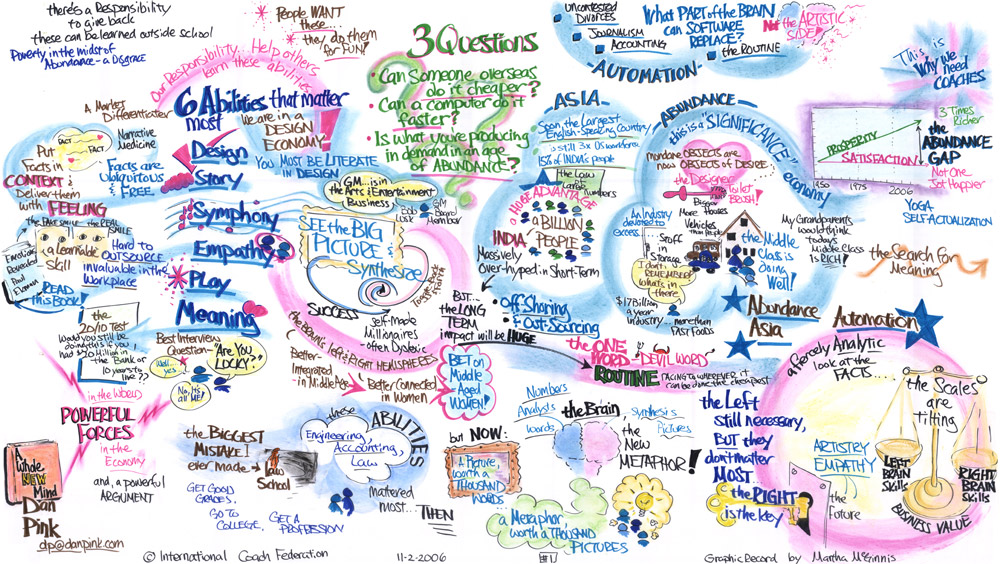
Out of hundreds of keynotes and presentations I’ve attended, one stands out from all the others, because it so vividly it changed my life.
In 2006, I had just completed an executive and life coach certification and dual Masters degrees in fine art and education. Inspired to learn more about my new coaching tribe, I flew to St. Louis to attend the International Coaching Federation conference. The headlining keynote was by Dan Pink, who talked about his new book A Whole New Mind: Why Right-Brainers Will Rule the Future. As a ”right-brain” thinker, I certainly liked the topic. Being a visual learner who often checks out (and starts sketching or fidgeting) during auditory-heavy talks, my hopes were modest. So I wasn’t prepared for what happened next.
Dan Pink walked on stage. Then, a woman joined him, and walked toward a gigantic sheet of white paper behind him. As Dan Pink spoke, she started drawing on the paper. I quickly saw that she was mapping out his concepts, synthesizing and drawing his ideas using a combination of words, graphics, and visual connections.
I became mesmerized as images and words emerged on the huge sheet Rather than distracting me from Pink’s talk, the live drawing drew me in. I was able to listen more deeply to the meaning of his words and how the ideas connected. I realized she was translating his talk, not into ASL or another spoken language, but into images, one of the most universal languages of all. I sat on the edge of my seat during the entire keynote to hear and see what would come next.
To this day, years later, I still recall and reference content from the keynote.
What tremendous impact and value-add from a 1-hour presentation! The artist was Martha McGinnis, and here is her graphic for that talk, hosted on visual-logic.net.

Death by Flip Chart
Fast forward to the present. I have expanded my work as an executive coach, and together with two business partners, I’ve started a talent strategy company called InspireCorps. In our work with leaders and teams, I write and draw on whiteboards and flip charts… a LOT. We write furiously to capture all the ideas we brainstorm, with no time for live editing or refining.
To get any value out of this, we then spend hours more reading through all the sheets to find the main ideas and synthesize them for our client. After one particular 2-day session in Charleston with a client this past February 2017, we had filled dozens of flip chart pages filled with lifeless verbiage. “Death by flip chart,” I joked with my business partner.
I knew there had to be a more intentional and meaningful way to record our client’s ideas. On the flight home from Charleston, I got a sudden spark of inspiration. I remembered the Dan Pink keynote. I got on my phone and Googled “person who draws what a keynote speaker says.” Popped up: Graphic facilitation.
Learning Graphic Facilitation
Just two months later, end of April 2017, I found myself at my first training in graphic facilitation. I spent a week in San Francisco at the Grove, a pioneer in this field, with one of their senior consultants, Rachel (here’s her TED talk).
One of the first things I learned, before doing any drawing or recording, was the importance of public listening. This means to listen deeply to what people say, don’t force ideas on them, and write their exact words on the board (because paraphrasing introduces subtle judgments and distortions). As a coach, this resonated with me.
Next, I learned the basics of graphic language, which includes words, images, color, and how they are all intentionally organized to capture people’s ideas, facilitate their thinking, and create a conceptual map of their conversation. Graphic facilitation brings the audience into the conversation as it is being recorded. At its best, it changes the quality of the conversation in the room by slowing people down, helping them think deliberately about the language they use, and allowing them to see their ideas connected and synthesized right in front of them. Ultimately, it’s as much about the process of visually mapping the conversation is it is about the end product, which can be a powerful archive and inspiring way to keep a conversation alive after it occurs.
Once I learned the basics of the graphic language, I learned how to use visual templates to graphically record team histories, visions, and strategic plans. I immed iately started thinking of specific clients who would benefit from this process and felt exhilarated by the possibilities for them. Visioning and strategic planning are central to our work at InspireCorp, and these new graphic tools would not only increase the quality of those conversations, but also provide our clients with a visual record of the key concepts. As part of the learning process in the workshop, I created my own visual template for an upcoming client session on marketing strategies for different audiences (see to the right).
Rachel, the workshop leader, taught us by creating graphic facilitations of the key concepts and our classroom discussions. This slowed down the conversation, increased my attention and information processing, connected me to others in the room, and helped me see new connections between visually represented ideas. By the last day of the workshop, I had fully experienced its power.
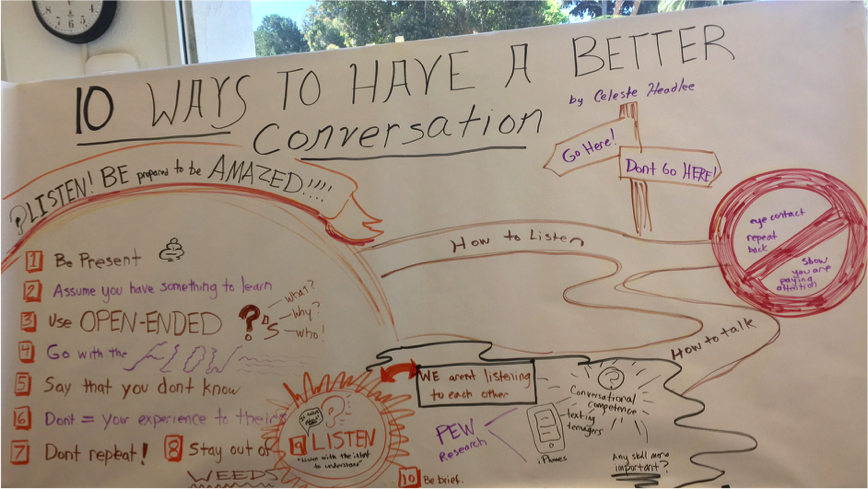
For my final project in the workshop, I created a graphic recording for a (pre-recorded) TED talk called 10 Ways to Have a Better Conversation by Celeste Headloe (see below). I listened to the TED talk twice to take notes and organize my thoughts about how to represent it using one of the visual organizing methods we had learned in the class (i.e., drawing, diagram, grid). I chose to try a drawing using a road that would map different important “stops” or main points of the talk along the way. Then, the instructor played the TED talk again for us to record live. It surprised me how fast I had to move and how challenging it was to process the speaker’s words and quickly decide what to draw and where to draw it, even with my prior planning. Nevertheless, the process of drawing her talk felt exhilarating. When I stepped back to see what the talk looked like, I could follow the logic of it through the words and images and thought: “truly, this is how my brain thinks!” At that point, I knew this process would become a game changer for InspireCorps. No more “death by flip charts” during a workshop facilitation! I see us using graphic recording to capture our clients’ ideas and guide their learning in a thoughtful, creative, and novel way that leaves them with a powerful visual archive of their work.
My spark of inspiration that began in 2006 has come full circle and now I stand at a new beginning. I realize that it is just a start and will require a lot of ongoing practice and focus to become as skilled as Martha McGinnis. Fortunately, I enjoy a challenge, especially when I know how it will add tremendous value to our clients. Feeling inspired to take action and practice… right away!